GlucoseGraph
GlucoseGraph is a simple Streamlit app that allows a user to display their own glucose (blood sugar) readings from a continuous glucose monitor (CGM). The intent is simply to provide users with an easier way to visualize their CGM data, which can be tricky and is somewhat limited with existing tools.
Using the app
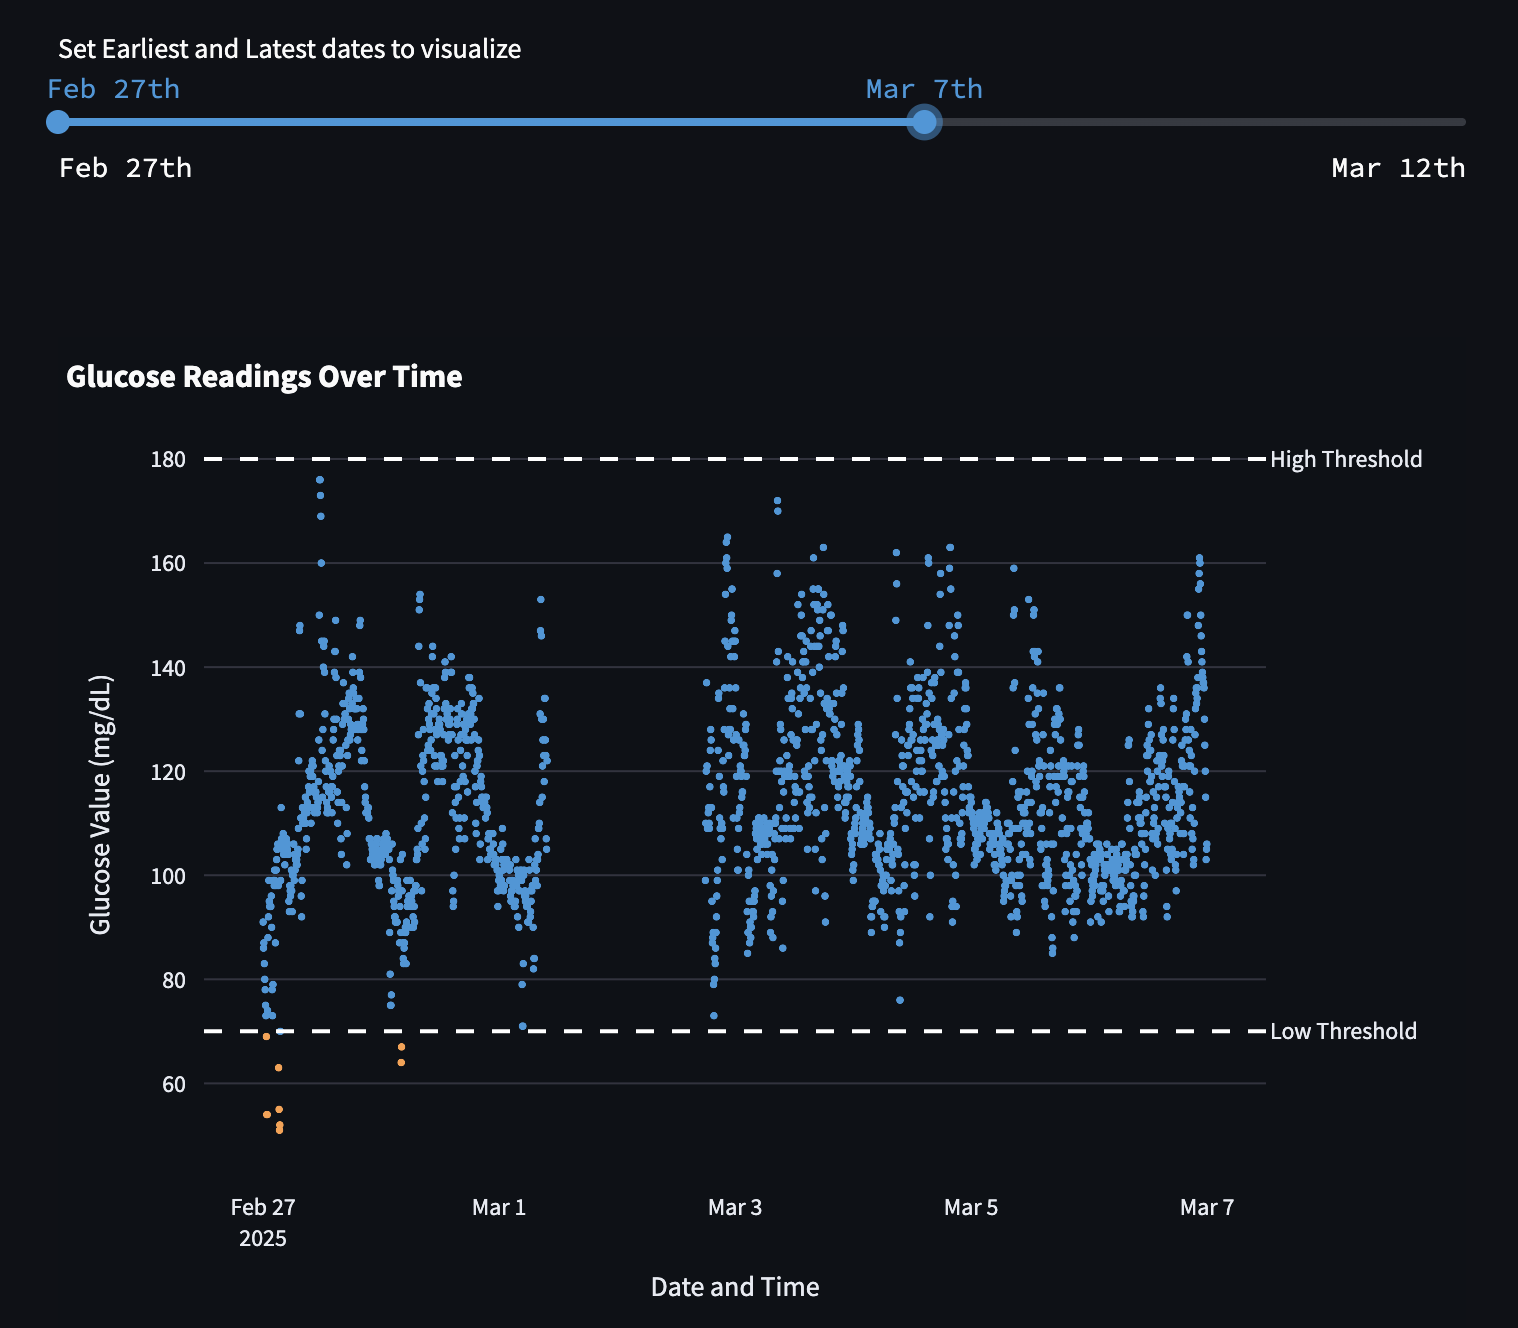
A user can upload CGM data and GlucoseGraph provides different charts and a clean table of the data. The plots include a time series chart, a line chart to discover any daily patterns, and a heatmap of glucose values in 20-minute increments. Additional details are available on the the Streamlit app.